
Lead developer of SiriDB.

Using Grafana with SiriDB
The goal of this blog is to setup a Grafana dashboard using the SiriDB plugin. SiriDB is an open source time series database that can be used to store any time related data.
For an attractive dashboard we need some data which we can visualize. In this tutorial we use a Python script that collects some cpu, disk and memory data from the localhost and some information about the running SiriDB processes. All this data will be stored in a SiriDB database and by using a Grafana Dashboard we are able to monitor the data.
We use a fresh Ubuntu 16.04 (desktop) installation so you might want to skip some steps or change some commands according to your operating system.
Update and install Git, Pip and libuv1 by using apt.
sudo apt update
sudo apt upgrade
sudo apt install libuv1 git python3-pip
We start by downloading the Python script (and this tutorial):
git clone https://github.com/SiriDB/grafana-siridb-http-example.git
cd ./grafana-siridb-http-example
Next we install SiriDB:
wget https://github.com/SiriDB/siridb-server/releases/download/2.0.26/siridb-server_2.0.26_amd64.deb
sudo dpkg -i siridb-server_2.0.26_amd64.deb
We don’t require SiriDB to start at startup so we disable the service:
sudo systemctl disable siridb-server.service
SiriDB has an admin tool which can be used to create and manage databases:
wget https://github.com/SiriDB/siridb-admin/releases/download/1.1.3/siridb-admin_1.1.3_linux_amd64.bin
chmod +x siridb-admin_1.1.3_linux_amd64.bin
sudo cp siridb-admin_1.1.3_linux_amd64.bin /usr/local/bin
sudo ln -s /usr/local/bin/siridb-admin_1.1.3_linux_amd64.bin /usr/local/bin/siridb-admin
There are several native clients available for communicating with SiriDB, for Grafana we will use SiriDB HTTP which provides a HTTP(S) API.
wget https://github.com/SiriDB/siridb-http/releases/download/2.0.5/siridb-http_2.0.5_linux_amd64.bin
chmod +x siridb-http_2.0.5_linux_amd64.bin
sudo cp siridb-http_2.0.5_linux_amd64.bin /usr/local/bin
sudo ln -s /usr/local/bin/siridb-http_2.0.5_linux_amd64.bin /usr/local/bin/siridb-http
SiriDB can scale data across multiple pools and each pool can have two servers for redundancy. We can play with this concept on a single host by running SiriDB multiple times using different ports. In a real scenario you should use different nodes but for now we will create four SiriDB nodes and setup two pools, each with two SiriDB servers.
This action will create four SiriDB configuration files:
for i in {0..3}; do `cat <<EOT > siridb$i.conf
[siridb]
listen_client_port = 900$i
server_name = %HOSTNAME:901$i
ip_support = ALL
optimize_interval = 900
heartbeat_interval = 30
default_db_path = ./dbpath$i
max_open_files = 512
EOT` && mkdir dbpath$i; done
Now we can start the SiriDB servers! The following command starts the four SiriDB servers in the background.
for i in {0..3}; do siridb-server -c siridb$i.conf > siridb$i.log & done
Hint: you can view the output from a SiriDB process by using for example
cat siridb0.logortail -f siridb0.log.
Now we need the SiriDB Admin tool to create the actual database. SiriDB has a default service account sa with password siri which we will use.
For our tutorial we will only need a database with second precision so we add the -t flag. We also select a shard duration of 6 hours for this database because our measurement interval will only be a few seconds. Sometimes you might want to store one value per measurement in each hour or even per day in which case your database will perform better by using a larger shard duration.
If you want to learn more about the admin tool, you can look at the Github page: https://github.com/SiriDB/siridb-admin#readme
Create the database on the first SiriDB server which is running on port 9000:
siridb-admin -u sa -p siri -s localhost:9000 new-database -d tutorialdb -t "s" --duration-num "6h"
Now we have a database and we can use the default database user iris with password siri to extend the database
with a replica on the second server (running on port 9001):
siridb-admin -u sa -p siri -s localhost:9001 new-replica -d tutorialdb -U iris -P siri -S localhost:9000 --pool 0 --force
Ok, now everything is ready to collect data (we configure the other two SiriDB servers later in this tutorial). Before we start the Python script to collect data we must install its dependencies:
sudo pip3 install siridb-connector psutil
Start the script. The script accepts arguments which can be viewed with python3 mon2siridb.py -h. If you are following this tutorial then the defaults should be fine.
python3 mon2siridb.py &> mon.log &
Let’s setup Grafana so we can view what we are collecting. First download and install Grafana:
wget https://s3-us-west-2.amazonaws.com/grafana-releases/release/grafana_4.6.1_amd64.deb
sudo dpkg -i grafana_4.6.1_amd64.deb
And install the Grafana-SiriDB-Datasource plugin:
sudo mkdir /var/lib/grafana/plugins/
sudo git clone https://github.com/SiriDB/grafana-siridb-http-datasource.git /var/lib/grafana/plugins/grafana-siridb-http-datasource
Start (or restart) Grafana:
sudo systemctl restart grafana-server.service
Before we can use the SiriDB datasource, we also need to configure and start the SiriDB HTTP connector. SiriDB HTTP requires a configuration file. For more information you can view the following Github page: https://github.com/SiriDB/siridb-http#readme
This will create a basic configuration file which is fine for our tutorial. Note that we connect to both, the first and second SiriDB server, for redundancy.
cat <<EOT > siridb-http.conf
[Database]
user = iris
password = siri
dbname = tutorialdb
servers = localhost:9000,localhost:9001

[Configuration]
port = 5050
require_authentication = True
enable_socket_io = True
enable_ssl = False
enable_web = True
enable_basic_auth = True
enable_multi_user = False
cookie_max_age = 604800
insert_timeout = 60
EOT
Start SiriDB HTTP
siridb-http -c siridb-http.conf > siridb-http.log &
Open a browser and go to http://localhost:3000. You should see the following page:
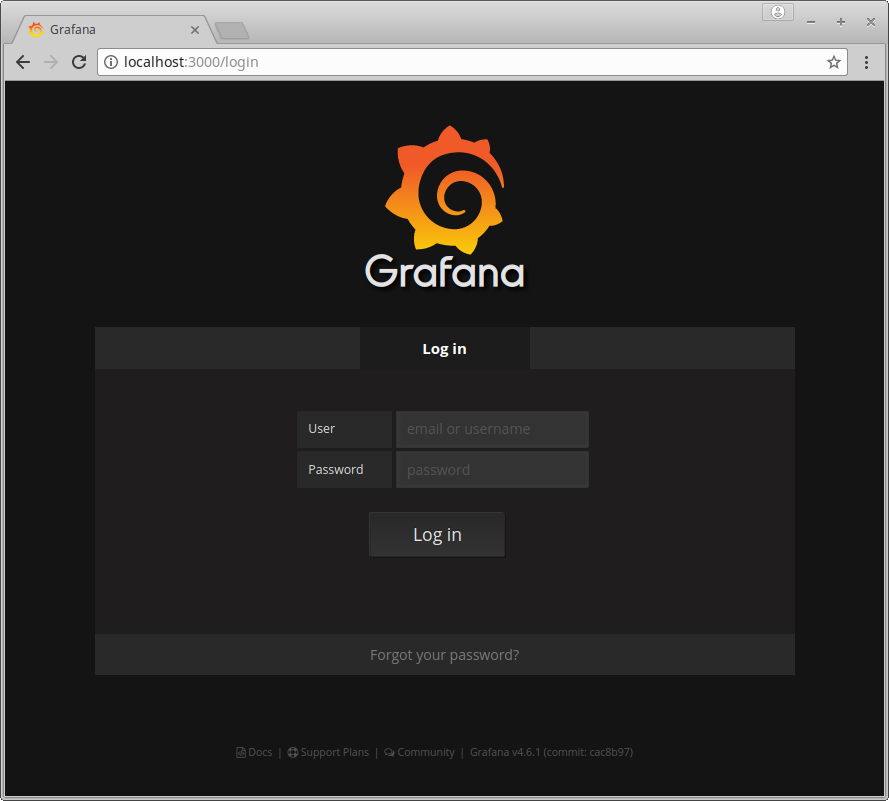
Sign-in by using username admin and password admin.
Click on Add data source to create the SiriDB data source. Fill in the form like in the picture below (use siri as password):
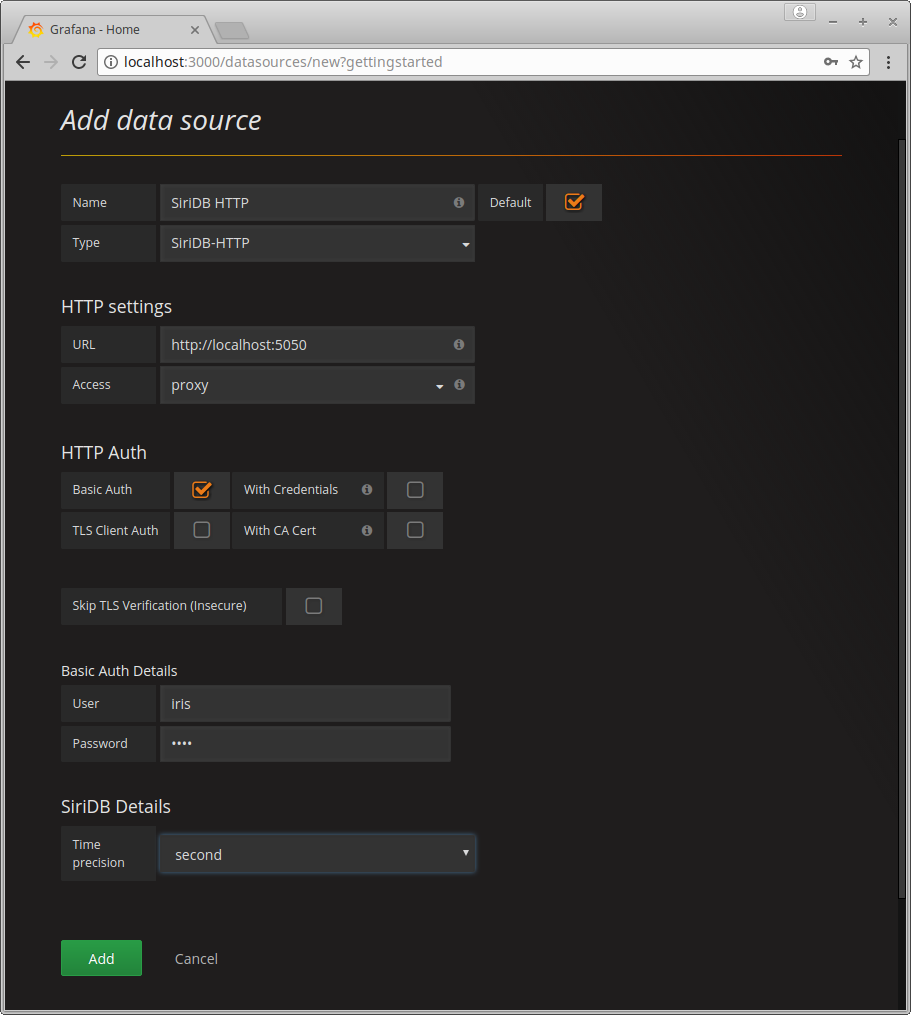
Click on Save and test this should return the message that everyting is working!
Go to the menu and click on Dashboards -> Import
Click on Upload .json File and select the tutorial-dashboard.json from this folder.
In the next window you should choose the SiriDB HTTP data source.
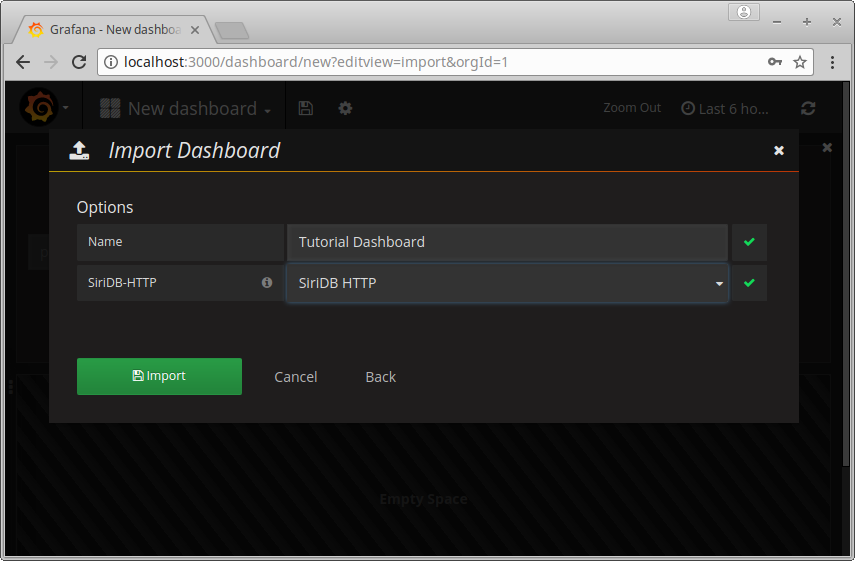
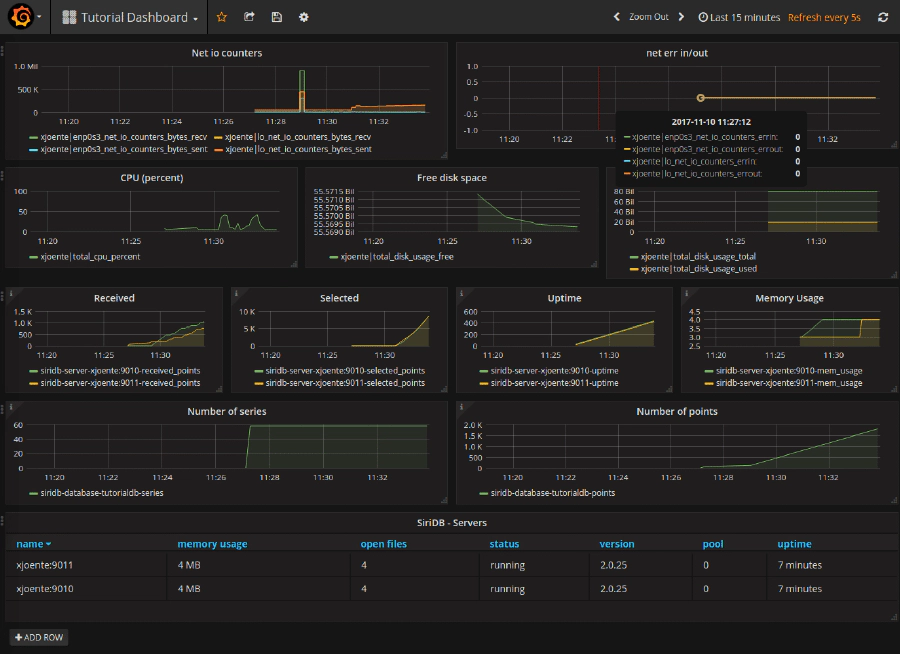
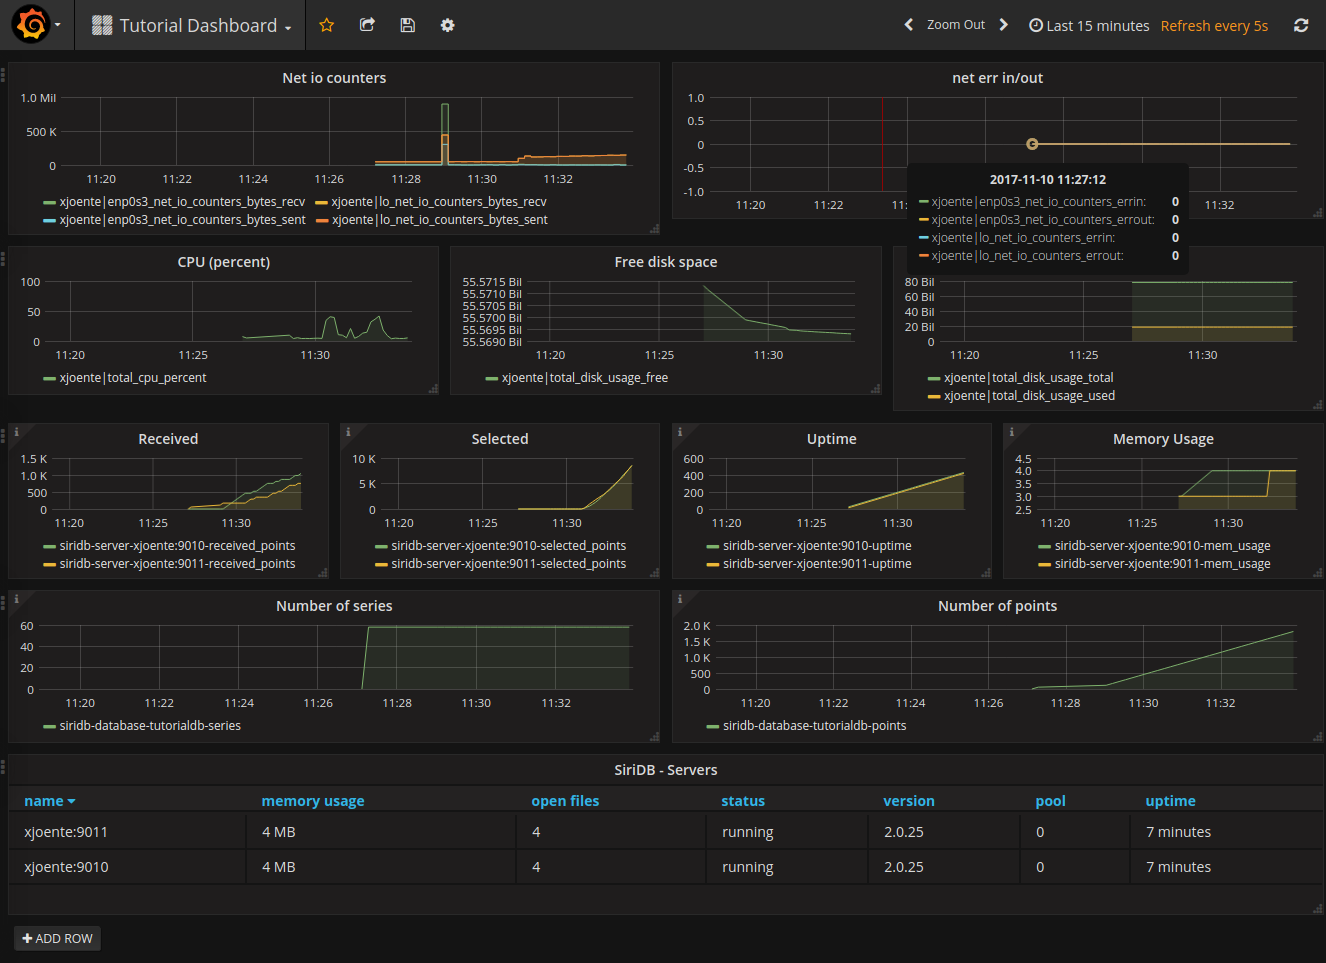
After clicking on Import you shout see a dashboard similar to this:
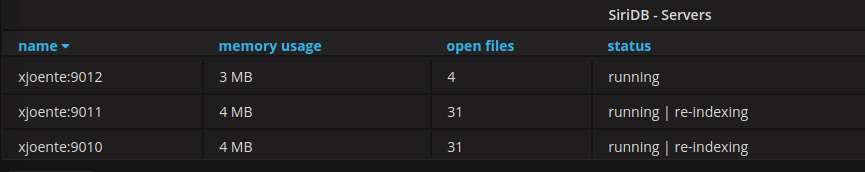
We can now continue by expanding the database with another pool and use the third server on port 9002.
siridb-admin -u sa -p siri -s localhost:9002 new-pool -d tutorialdb -U iris -P siri -S localhost:9000 --force
In the dashboard you should see the new server. The status for the existing servers includes re-indexing while the series are spread across the pools.
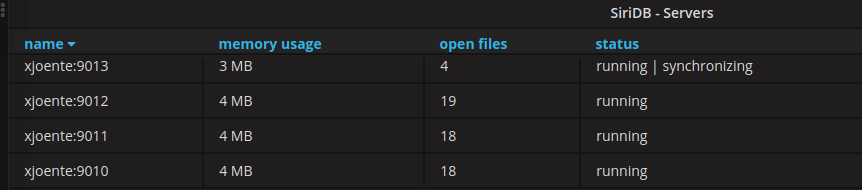
Wait until the status for all three server is running and then create another replica on the fourth server (on port 9003):
siridb-admin -u sa -p siri -s localhost:9003 new-replica -d tutorialdb -U iris -P siri -S localhost:9000 --pool 1 --force
The dashboard should show the fourth server with status synchronizing
From this point on it should be rather easy to create you own Grafana Dashboard by using a SiriDB database. As an example we will add two extra graphs for Disk IO counters.
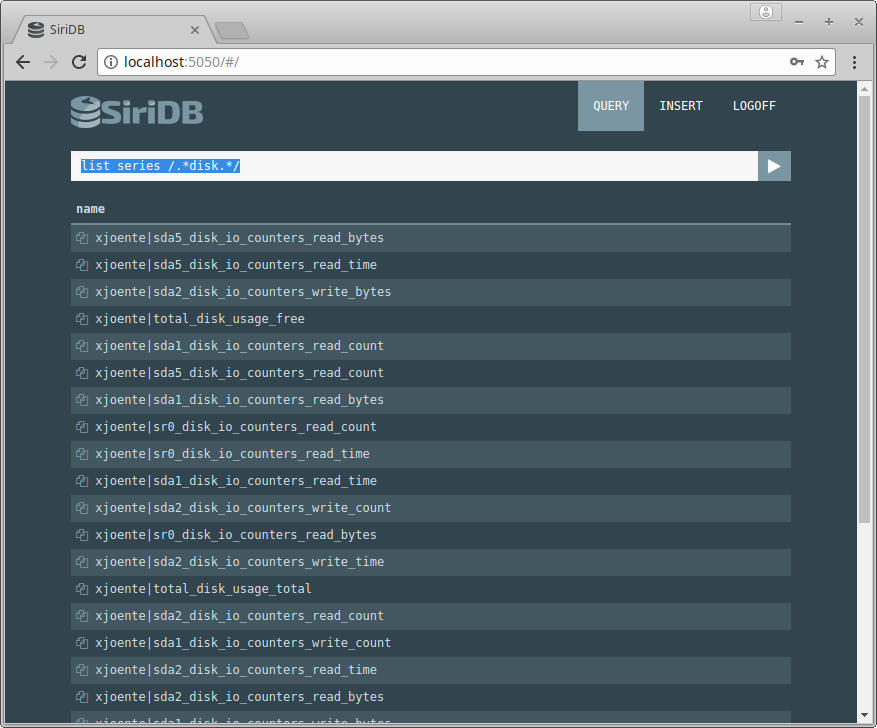
It might be helpful to test SiriDB queries. We can do this by using the running SiriDB HTTP webserver.
Go to http://localhost:5050. Here you should see the following screen:
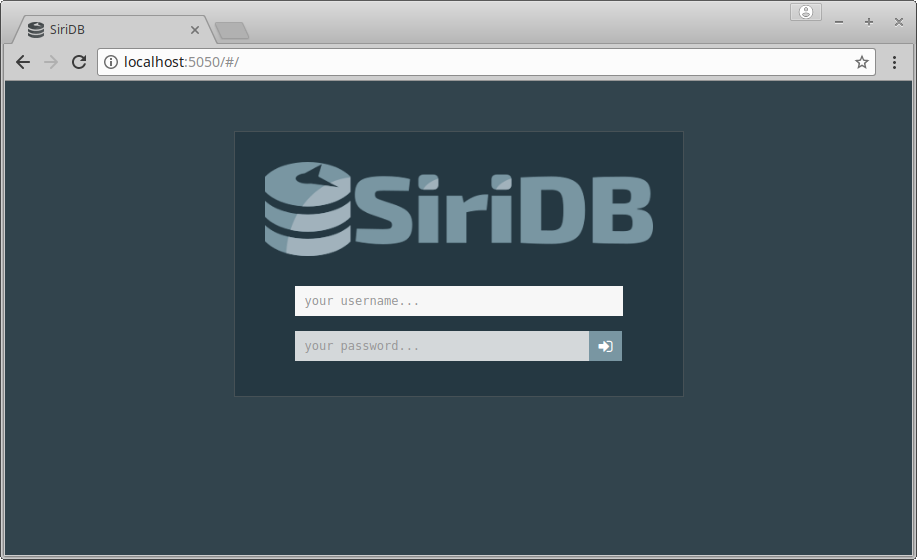
Login by using the default user iris with password siri.
Now you have a prompt available where you can test queries, for example:
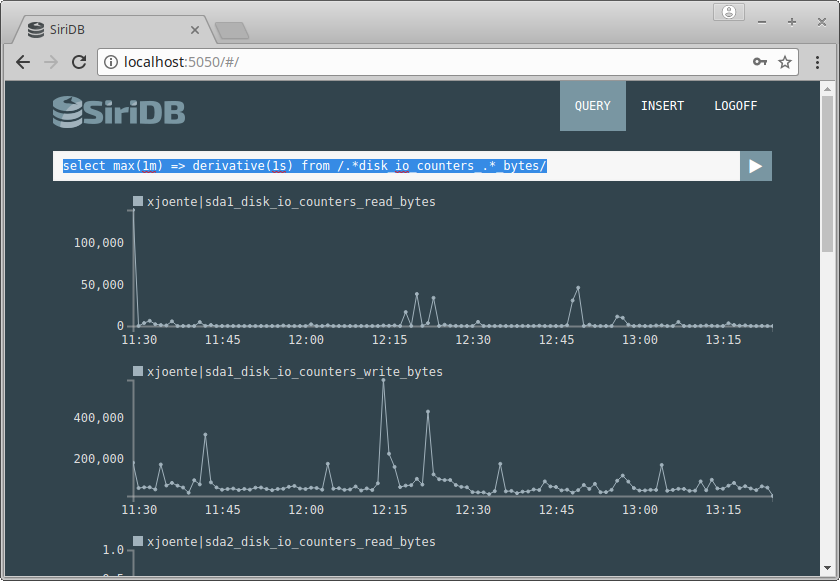
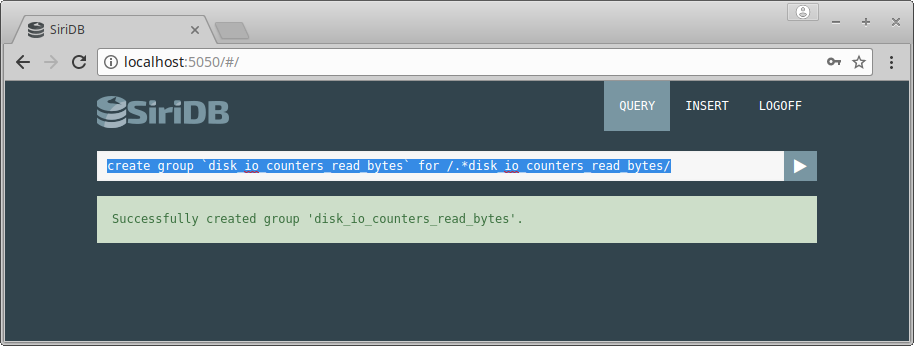
If you want to select series based on regular expression, then a best pratice is to create a dynamic group. For the current example we create the following two groups:
create group `disk_io_counters_read_bytes` for /.*disk_io_counters_read_bytes/
create group `disk_io_counters_write_bytes` for /.*disk_io_counters_write_bytes/
Go back to Grafana and click on Add row -> Graph. Click on the new Panel title and click on Edit.
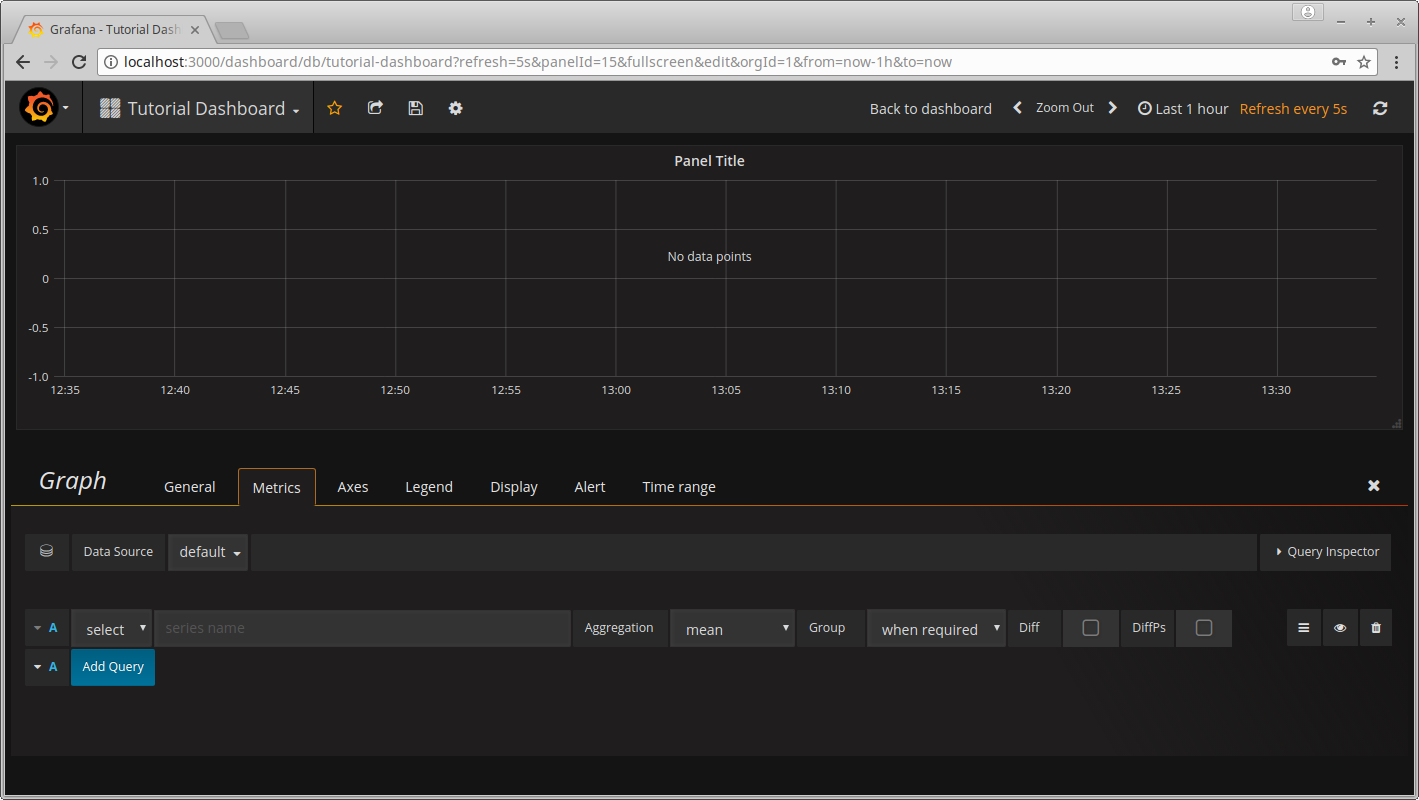
At select fill in `disk_io_counters_read_bytes`, choose max as aggregation and enable Diffps.
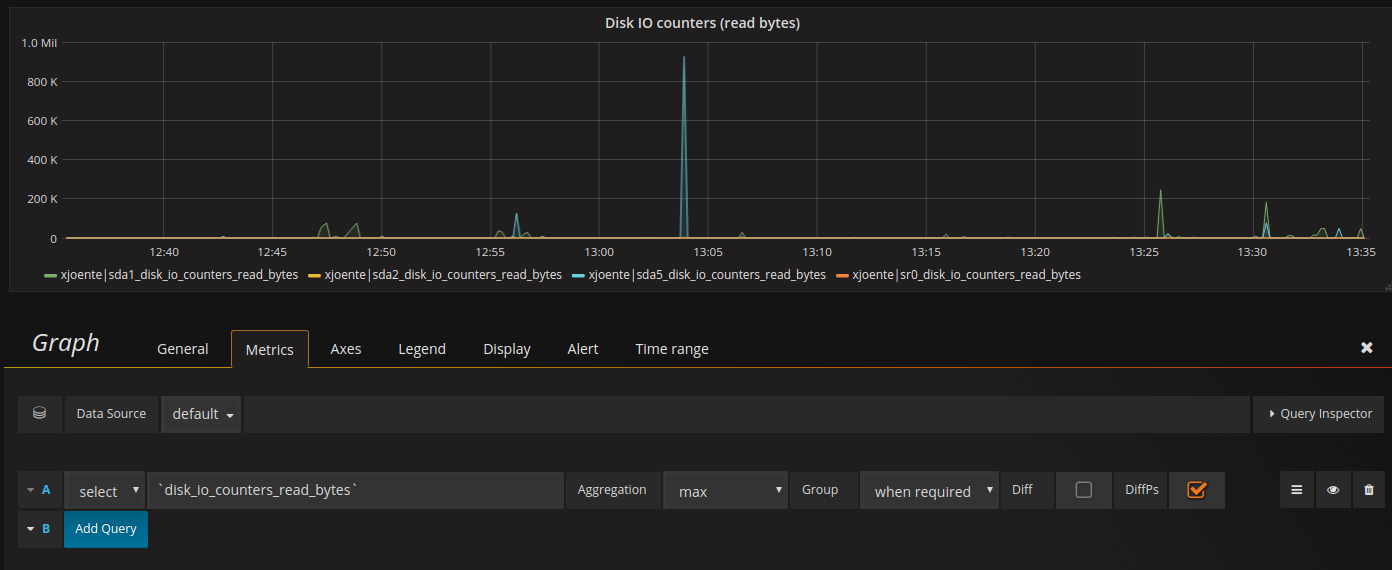
On the General tab you can change the panel title to “Disk IO counters (read bytes)”.
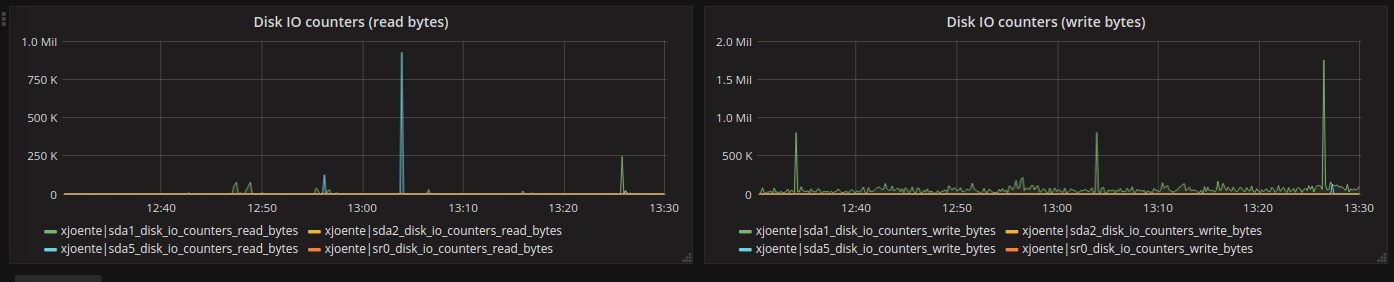
Repeat these steps for the write counters and when you are finished you should have the following result:
I hope this tutorial was helpful and I am looking forward to hear what you can create by using Grafana and SiriDB!